Note
Go to the end to download the full example code.
Example 1#
import numpy as np
import matplotlib.pyplot as plt
import qpmr
import qpmr.plot
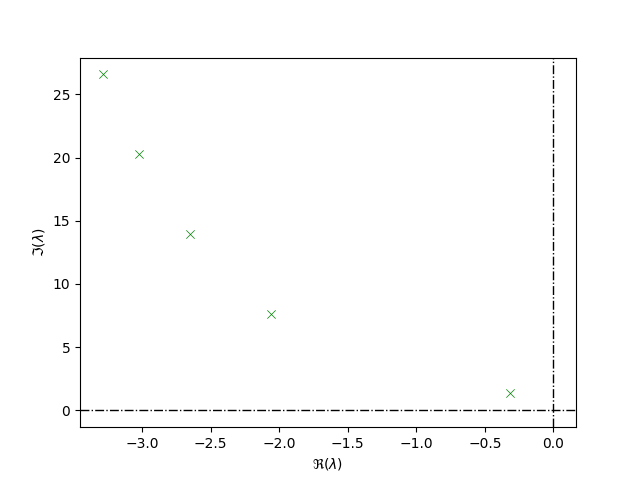
delays = np.array([0.0, 1.0])
coefs = np.array([[0., 1],[1, 0]])
roots, meta = qpmr.qpmr(coefs, delays, [-10, 2, 0, 30])
qpmr.plot.roots(roots)
plt.show()
Total running time of the script: (0 minutes 0.236 seconds)