Note
Go to the end to download the full example code.
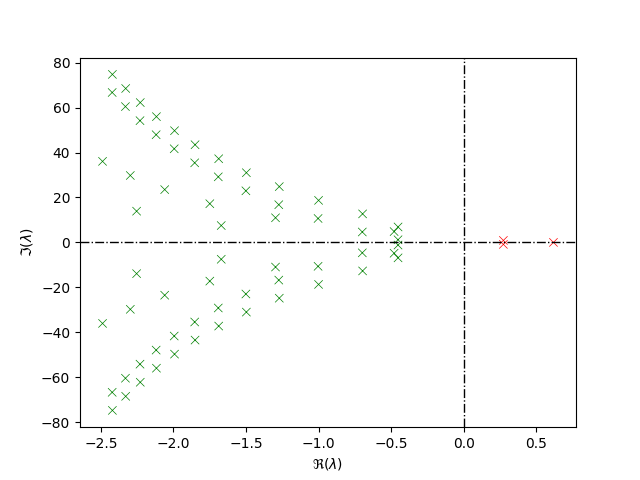
Example 2.1 - Stability analysis of retarded DDE#
We consider the following retarded delay differential equation (RDDE) from [Verheyden et al., 2008] Section 6.1:
\[\begin{split}\dot{x}(t) =
\begin{bmatrix}
-1 & 0 & 0 & 0 \\
0 & 1 & 0 & 0 \\
0 & 0 & -10 & -4 \\
0 & 0 & 4 & -10
\end{bmatrix} x(t)
+
\begin{bmatrix}
3 & 3 & 3 & 3\\
0 & -1.5 & 0 & 0 \\
0 & 0 & 3 & -5 \\
0 & 5 & 5 & 5
\end{bmatrix} x(t-1).\end{split}\]
We will follow the steps from [Appeltans and Michiels, 2023] Section 2.2 to achive the same results as presented there, i.e. we will
create the
RDDEmatrix representationcompute characteristic roots via the
tdcpy.rootsfunctionplot the computed characteristic roots using
tdcpy.plot.eigen_plotfunction
import matplotlib.pyplot as plt
import numpy as np
import tdcpy
import tdcpy.plot

# Create RDDE matrix representation
A0 = np.array([[-1, 0, 0, 0],
               [0, 1, 0, 0],
               [0, 0, -10, -4],
               [0, 0, 4, -10]])
A1 = np.array([[3, 3, 3, 3],
               [0, -1.5, 0, 0],
               [0, 0, 3, -5],
               [0, 5, 5, 5]])

rdde = tdcpy.RDDE(A=[A0, A1], hA=[0, 1])
cr, info = tdcpy.roots(rdde, r=-2.5)

tdcpy.plot.eigen_plot(cr)
plt.show()
Total running time of the script: (0 minutes 0.174 seconds)