Note
Go to the end to download the full example code.
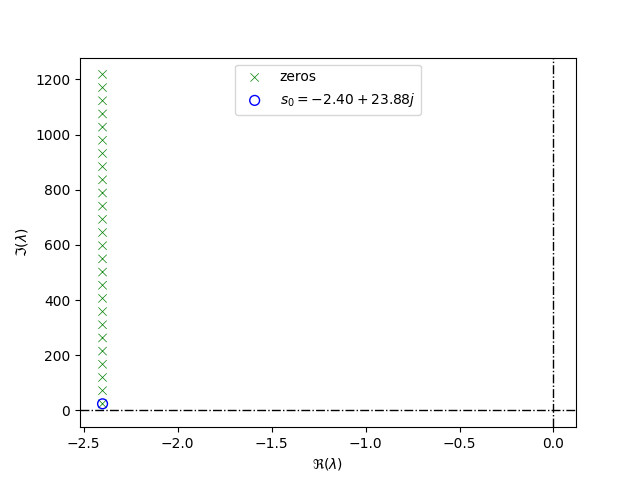
Spectrum of zero-vibration (ZV) input shaper#
import matplotlib.pyplot as plt
import numpy as np
import tdcpy
import tdcpy.plot

s0 = -24 * 0.1 + 24 * np.sqrt(1 - 0.1**2) * 1j

beta, omega = -np.real(s0), np.abs(np.imag(s0))
shaper_length = np.pi / np.abs(np.imag(s0))
exponent = np.pi * -np.real(s0) / np.abs(np.imag(s0))
shaper_gain = np.exp( exponent ) / (1 + np.exp( exponent ))

ddae = tdcpy.DDAE(
    E = np.zeros(shape=(0,0), dtype=np.float64),
    A = np.zeros(shape=(0,0,0), dtype=np.float64),
    hA = np.zeros(shape=(0,), dtype=np.float64),
    B = np.zeros(shape=(0,2,0), dtype=np.float64),
    hb = np.zeros(shape=(0,), dtype=np.float64),
    C = np.zeros(shape=(1,0,0), dtype=np.float64),
    hC = np.zeros(shape=(0,), dtype=np.float64),
    D = [ np.array([[shaper_gain]]), np.array([[1 - shaper_gain]])],
    hD = [0, shaper_length],
)

zeros, _ = tdcpy.zeros(ddae, r=[-100, 10, 0, 1250])

fig, ax = plt.subplots()
tdcpy.plot.eigen_plot(zeros, ax=ax, label="zeros")
ax.scatter([np.real(s0)], [np.imag(s0)], s=50, facecolors='none',
           edgecolors='b', marker="o", label=rf"$s_0={s0:.2f}$")
ax.legend()
plt.show()
Total running time of the script: (0 minutes 0.084 seconds)